
U.S. Blood Donation Statistics and Public Messaging Guide
Download the definitive guide to U.S. blood donation and public messaging, where you can explore over 40 verified statistics that offer crucial insights into America's blood supply and its donors. This guide is designed to provide the latest look at the state of blood donations, utilizing data from rigorously researched sources and expert input.
Over 40 verified statistics from published research
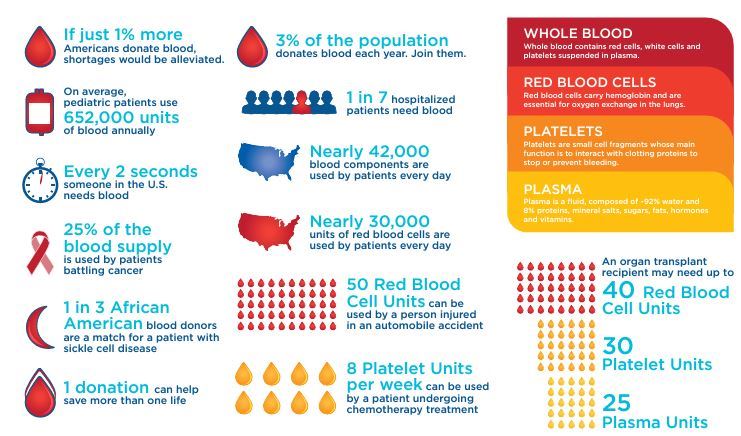
| Explore the newly updated guide, featuring 40+ verified statistics on the blood supply, donor demographics, and the impact of COVID-19 on donations. Learn about the pivotal role of younger and diverse donors in ensuring the long-term stability of the U.S. blood supply. The latest edition of this guide highlights that, in the United States:
|
Customizable Social Media and Infographics
|
|
|
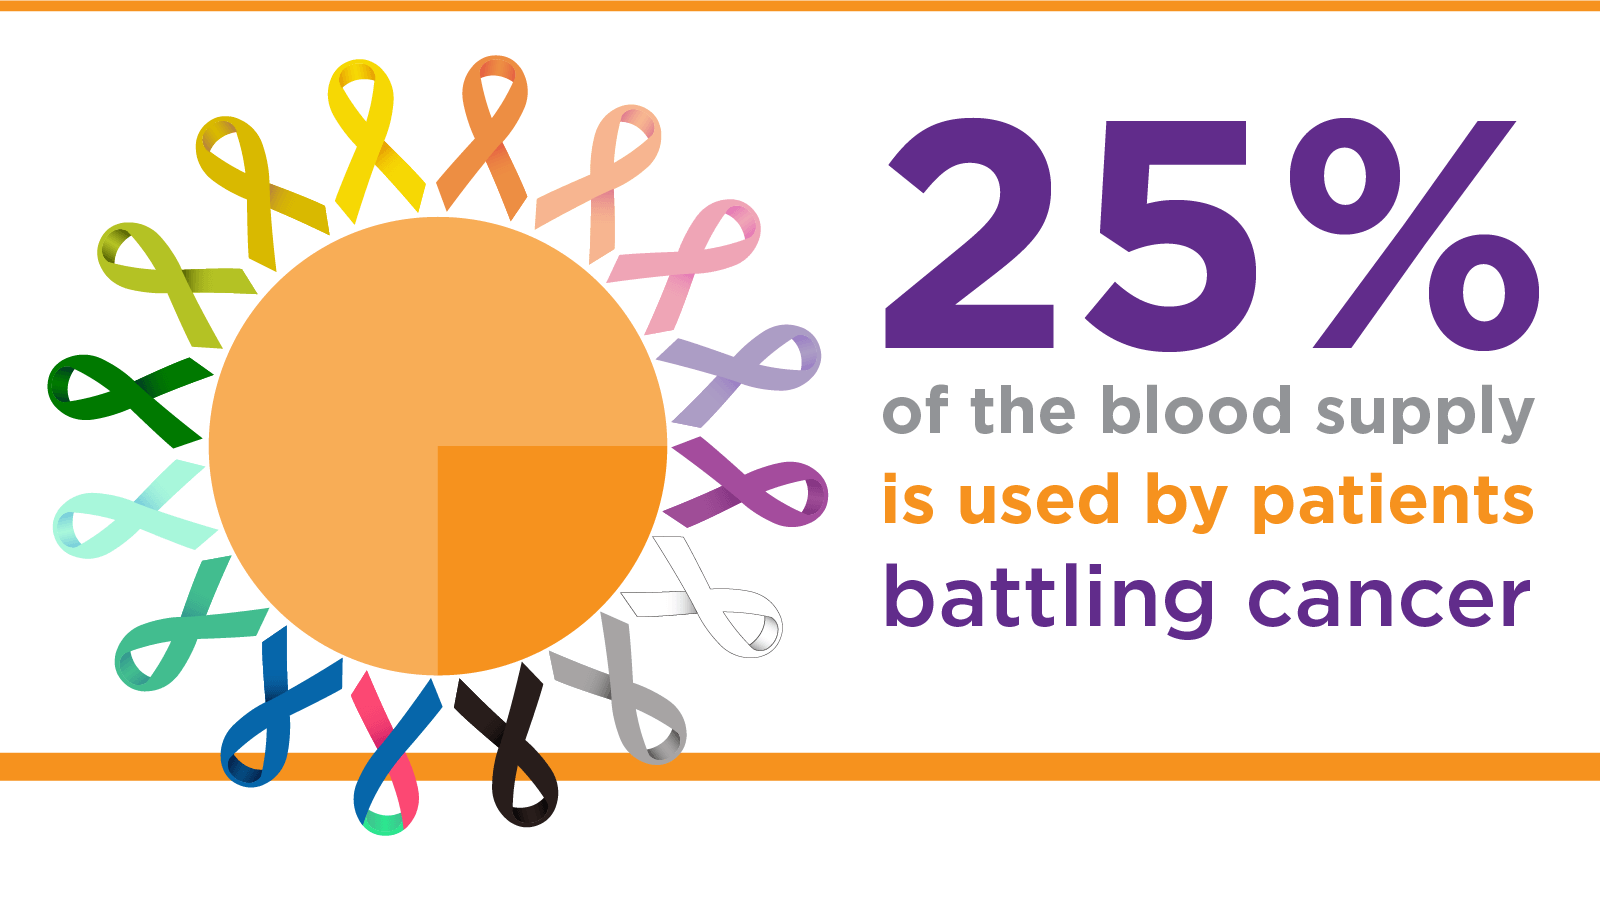
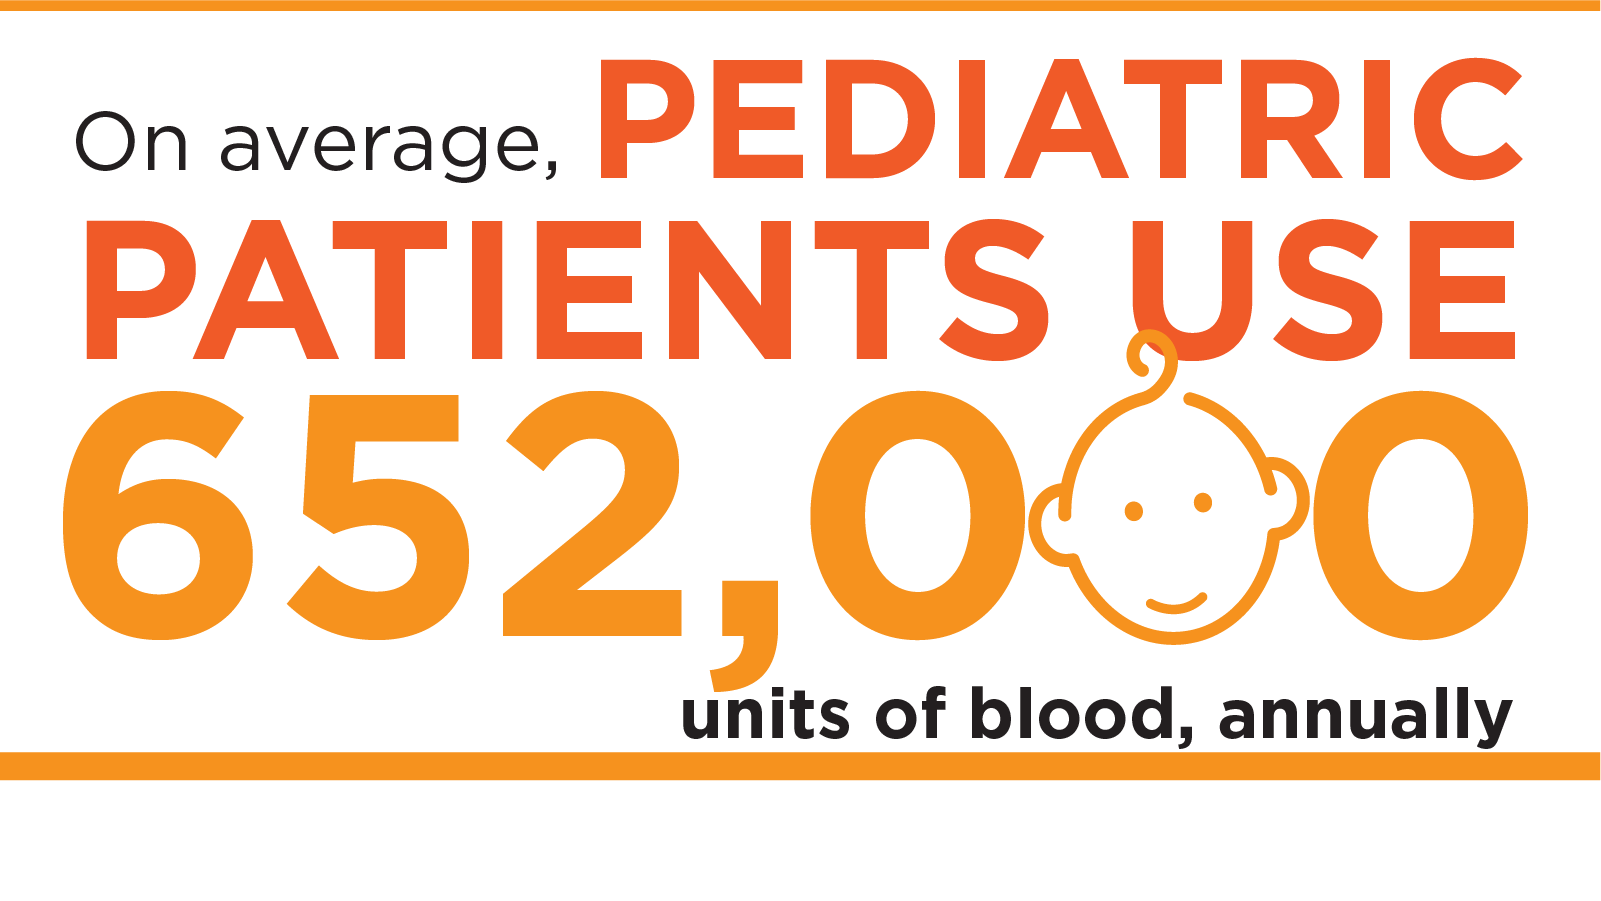
This guide includes a collection of customizable social media graphics and infographics designed to effectively communicate vital statistics and engage audiences. These resources are fully editable, ensuring that you can easily share important information and raise awareness on various platforms. |
|
America’s Blood Centers (ABC) and ADRP, the Association for Blood Donor Professionals, thank the ADRP Marketing Resource Committee and the ABC Scientific, Medical, and Technical Committee for their support and involvement in developing this resource.